Tuesday, March 3, 2015

Metadata for Aggregated Data Sets

Aggregated or "rolled up" data is a compilation of locally sourced data assembled into a single, often standardized data set.  This often occurs at the state level such as state standardized address or parcel data.

Many consumers of aggregated data use it as produced and need no additional information about it.  Some users need additional information from local providers or need information about how source data was generated or fitness for use and need locally sourced metadata.

Metadata for a compiled or aggregated data set might describe the compilation process, any data transformation or standardization by the aggregator, and the identity of source contributors.  This could be accomplished with current metadata tools and standards, but it could be lengthy and tedious to maintain.

Another approach could be to develop metadata about each contributor and their source data set and then link those individual metadata records from the compiled metadata.  It may be difficult to associate which record in the compiled file matches which metadata file, and it may be challenging to maintain, but it could be accomplished with the current tools and standard formats.

A third approach, and one that is advocated in the PLSS Cadastral Publication standard, is to develop a spatial feature, termed metadata at a glance, that provides the geometry of the extent for each contributor, the date the source information was added to the compiled data set, the identified custodian or steward for the data, and a link to the contributors metadata about their source data.  The compiled metadata record describes how the data are aggregated and focuses on describing the compiled product, but the metadata at a glance directs users to original sources. 

Using this metadata at a glance approach, the geographic extent for each contributor can be easily viewed and the last update and perhaps an accuracy summary can be seen at a glance.  The compiled data set metadata will focus on the methods and standards of aggregation and compilation.  The currency and contributors will be readily visible and accessible through the metadata at a glance.  Links to source custodians and source data can be found from the metadata at a glance. 


Spatially enabled geospatial metadata.
Thursday, May 29, 2014

Aereo, ABC and Parcel Data

-->
In late April the Supreme Court heard arguments on if Aereo, a company with thousands of small (tiny actually) digital antennas, could collect programs broadcasted over the air, package them and distribute the freely collected information over the internet, for a price.  The data is compiled onto cloud storage and can be consumed for a price on any screen. 

Several news articles called this a disruptive business model  (http://freakonomics.com/2014/04/28/whats-at-stake-in-the-aereo-case-maybe-the-future-of-the-cloud/). The issue at hand was could Aereo take the freely broadcasted signals and sell them through cloud services.  The problem being that ABC and other broadcasters sell those same signals to cable and dish networks for a fairly significant amount.

In my opinion there are many elements of this case that are similar to parcel data, of course.  Many states and counties and cities produce parcel data for their internal use and then “broadcast” or provide the data freely.  As we have seen time and time again, commercial vendors assemble that free data, repackage it, and sell it.

Most recently for example, a firm sent out a notice that users could purchase high-resolution aerial photography for southeastern Ohio (www.emap-int.com).  This is the part of Ohio with the Utica Oil Shale fracking activities.  But this very same product is freely available through the State of Ohio OGROP program http://ogrip.oit.ohio.gov/ProjectsInitiatives/OSIPDataDownloads.aspx.

So why is capturing freely broadcast programming and reselling it disruptive and taking freely available GIS data and reselling it not disruptive?  Maybe neither are disruptive, maybe it’s just the American free market. 

Wednesday, January 29, 2014

Geospatial Metadata and ITunes

Listening to the remembrances of Pete Seeger this week and being reminded again of how he used music to build communities and reach across ages gave me an idea.

What if we used music to date our geospatial data and standards?  We could link to ITunes songs and it would universally convey not only the time period of the data set but also would relate the data or standards to other things going on at the time.

For example, what if I told you the Cadastral Data Content Standards were published when Pearl Jam’s Better Man and Daughter, Madonna’s Secret, and Melissa Etheridge’s Come to My Window were getting a lot airplay.  Does that convey a sense of what was going on, what you were working on at the same time, and how much time has passed?

Or what if you thought about when we first explored statewide parcel data sets in the modern GIS era Jon Bon Jovi’s Miracle, Phil Collins’ Do You Remember and Another Day in Paradise, and Vanilla Ice with Ice Ice Baby were on everyone’s walkman or car radio probably more like it. 

Maybe Baha Men and Who Let the Dogs Out would be a good tune for the 2000 Census, one of those benchmark data sets.  What if Who Let the Dogs Out played on your computer when you opened a 2000 Census data set?  Would that be sufficient warning about the data vintage?

We should give some thought to adding an ITune link that would open with the data set to our metadata.  It might make it easier to date it, easier to relate its vintage to other data sets, and maybe even make the metadata memorable.  You could scroll through a play list instead of clicking the metadata links.  It would definitely make geospatial metadata and dating our standards more interesting.

Next time you publish a data set think about what your are listening to, what's your data set's tune?


Thursday, December 26, 2013

Geospatial in the Technology Revolution

The January 2014 issue of Harpers has an intriguing article by Jeff Madrick, “The Anti-Economist - The Digital Revolution That Wasn’t”. 

Mr Madrick restates one of the Adam Smith’s principles; rising productivity is the source of the wealth of nations, in terms of technology. "Technologies that disrupt the labor force in one area eventually tend to benefit everyone because of increases in productivity.  Increases in the amount of goods and services delivered per hour of work generally lead to greater prosperity. Some jobs are eliminated but more and better paying jobs often replace them."

"Productivity growth actually started to fall well before the 2008 recession.  While some of the early hardware and software developments did create as much as 3% productivity gains, this did not last." 

At the heart of his thesis is that the new information companies, and in fact the new communication/information technology revolution does not create jobs.  We are four decades into the digital age and the economic benefits have not been manifested.

Granted this one view of the information age and its economic impact, but there are some interesting challenges for us in the geospatial information industry.  Geospatial technologies are part of the information age revolution. There are certainly new jobs in geospatial information that did not exist 5, 10, or 20 years ago.  If one of the trends in the geospatial industry is toward web based solutions and apps that can present answers to common questions, where are the high-end geospatial analysis professionals? As geospatial professionals are we really pushing forward and looking forward?  Are we being disruptive and contributing to productivity gains?  Some interesting challenges to consider as we move into the New Year.


The full article can be found here (it may require a login to get to the full article) http://harpers.org/archive/2014/01/

Thursday, December 19, 2013

Add WFS to ArcGIS Arc Map Canvas

Adding Web Feature Services (WFS) to ArcMap is a useful process if you want to find and add data that is not on ArcGIS Online or data that is only provided as a feature service and not a web service or REST service.  The WFS drawing and access may be slightly slower than other service access, so be aware of the number of features and the scale of the display.  The advantage is the data is provided as features and can be manipulated as features.

Adding a Parcel WFS with Parcel GML to ArcGIS desktop is a six step process.

Step 1 - Install Data Interoperability Functionality

The data interoperability extension has to be installed on your desktop but it does not have to be licensed.  To install the extension without purchasing it or going through the set up that requires a license requires the following steps.

Find the DVD with the ArcGIS Media.  This may be a virtual drive, if it is, mount the virtual drive to access the data interoperability set up.  When you open either the virtual drive or the physical media, a standard Esri install/set up screen displays.  Don’t use this route.  Open the drive in windows explorer and find the DataInterop folder.  In that folder is a set up application.  Run the set up application (not the set up configuration settings or the set up windows installer). Accept the licensing terms and select an installation folder, just like normal installs.

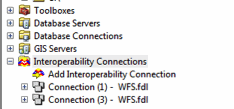
When you open Arc Catalogue the Interoperability Connections will appear in the list of potential connections as shown in Step 1 below.  There is no need to customize the extension since this activation will require a paid up license.

 Step 2 – Add WFS Service to Interoperability Connections

Open Arc Catalog and expand the Interoperability Connections.

Step 3 – Select Add Interoperability Connection

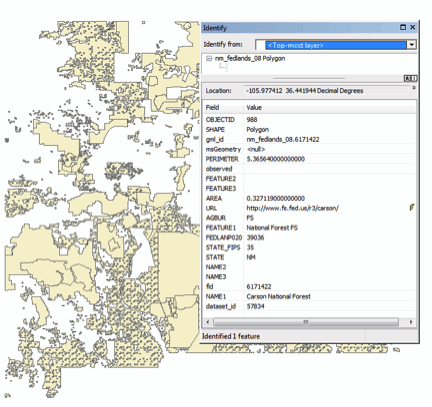
Select WFS from the format selection box and enter the service URL as shown in the Dataset window below.  This example is the federal land ownership WFS from the State of New Mexico.  One tip is to let the service determine the Reader Format.


Step 4 – Set Parameters

There are several parameters for the service that can be set by hand.  In this example the number of features was constrained to 30,000 to increase the speed performance.  The next two screens show the parameters.


Verify the connection by selecting the preview tab in Arc Catalogue.


Step 5– Rename the Connection (Optional)

The connection can be renamed so it can be easily identified when adding it to a Map Document.


Step 6 – Add Data to Map Document

In ArcMap Select Add Data.  Navigate to the Interoperability Connection in the Look in: pull down and double click on the feature class.  In this case the Fed-Lands-New-Mexico.


Select the Fed-Lands-New-Mexico.fdl (expand the database symbol to see the feature class).


Click on the Feature and then the Add button. The feature will index as it adds.

The Federal Lands GML features are now available on your active ArcGIS canvas.  If the ArcGIS map document is saved, each time the map document is opened the service will access the most current Fed Lands from New Mexico GML data available from the WFS.


The data from the WFS can be filtered by time stamp, by feature attribute, and symbolized, queried, and used in the desktop just as any other locally source data.